
'll Hacker
[ML 실습] 6일차 복습- 판다스 DataFrame(3) 본문
sort_values( ), Aggregation 함수, GroupBy 적용
sort_values( )
형식: sort_values(by=['칼럼명'], ascending=True, inplace=False)
by로 특정 칼럼을 입력하면 해당 칼럼으로 정렬을 수행한다.
ascending=True(디폴트)로 설정하면 오름차순으로 정렬한다. ascending=False는 내림차순.
sort_values( )를 호출한 DataFrame은 그대로 유지하며 정렬된 DataFrame을 결과로 반환한다.
titanic_sorted = titanic_df.sort_values(by=['Name'])
titanic_sorted.head(3)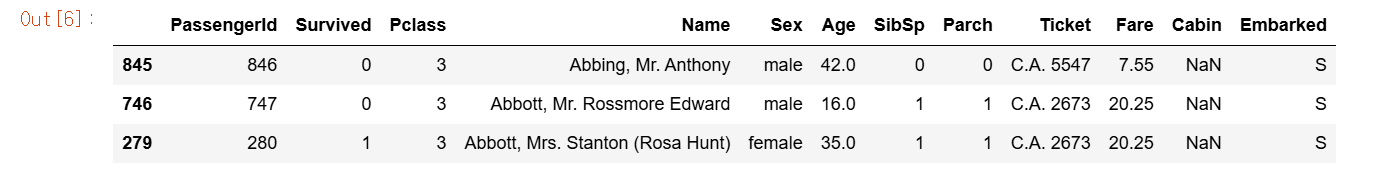
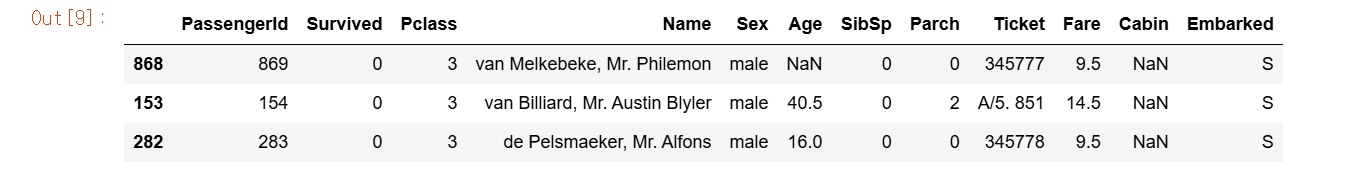
여러 개의 칼럼으로 정렬하려면 by에 리스트 형식으로 정렬하려면?
titanic_sorted = titanic_df.sort_values(by=['Pclass','Name'],ascending=False)
titanic_sorted.head(3)
Aggregation 함수 적용
aggregation함수에는 min( ), max( ), sum( ), count( )가 있다.
Dataframe의 경우에는 DataFrame에서 바로 aggregation을 호출할 경우 모든 칼럼에 해당 aggregation을 적용한다.
titanic_df.count()
count( )는 NULL값을 반영하지 않은 결과를 반환하기 때문에 NULL값이 있는 Age, Cabin, Embarked칼럼은 count( )결과값이 다르다.
특정 칼럼에 aggregation 함수를 적용하기 위해서는 DataFrame에 대상 컬럼들만 추출해 aggregation을 적용하면 된다.
titanic_df[['Age','Fare']].mean()
groupby( ) 적용
DataFrame의 groupby( ) 사용 시 입력 파라미터 by에 칼럼을 입력하면 대상 칼럼으로 groupby된다. DataFrame에 groupby( )를 호출하면 DataFrameGroupBy라는 또 다른 형태의 DataFrame을 반환한다.
titanic_groupby = titanic_df.groupby(by='Pclass')
print(type(titanic_groupby))
SQL의 group by와 다르게, DataFrame에 groupby( )를 호출해 반환된 결과에 aggregation함수를 호출하면 groupby( ) 대상 칼럼을 제외한 모든 칼럼에 해당 aggregation함수를 적용한다.
SQL에서는
Select count(PassengerId), count(Survived),... from titanic_table group by Pcalss대상칼럼을 모두 select절에 나열해야한다.
하지만, DataFrame의 groupby( )에 특정 칼럼만 aggregation 함수를 적용하려면 groupby( )로 DataFrameGroupby 객체에 해당 칼럼을 필터링한 뒤 aggregation함수를 적용한다. ⏬
titanic_groupby = titanic_df.groupby('Pclass').count()
titanic_groupby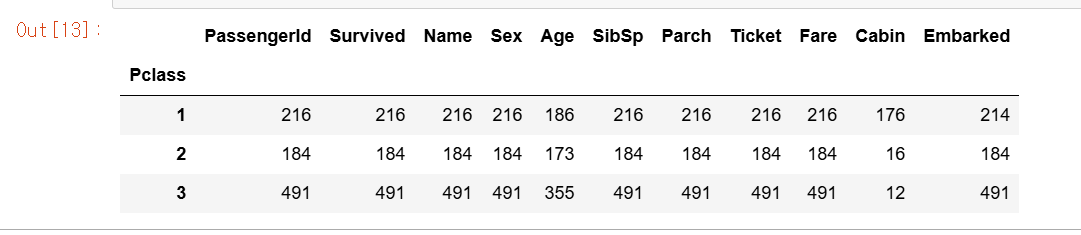
# titanic_df.groupby('Pclass')로 반환된 DataFrameGroupBy 객체에 [['PassengerId','Survived']]로 필터링해 PassengerId와 Survived 칼럼에만 count()를 수행한다
titanic_groupby = titanic_df.groupby('Pclass')[['PassengerId','Survived']].count()
titanic_groupby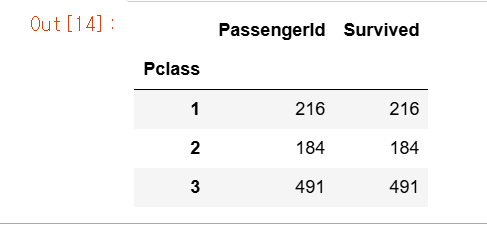
titanic_df.groupby('Pclass')['Age'].agg([max, min])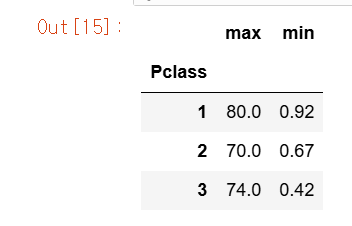
Select max(Age), min(Age) from titanic_table groupby Pclass와 같은 SQL은 다음과 같이 groupby( )로 반환된 DataFrameGroupby 객체에 agg( )를 적용해 위 코드와 같이 동일하게 구현할 수 있다.
SQL은 Select max(Age), sum(SibSp), avg(Fare) from titanic_table group by Pclass와 같이 쉽게 가능하지만, DataFrame groupby( )는 좀 더 복잡한 처리가 필요하다. groupby( )는 agg( )를 이용해 이 같은 각 칼럼 처리가 가능한데, agg( ) 내에 입력값으로 딕셔너리 형태로 aggregation이 적용될 칼럼들과 aggregation 함수를 입력한다.
agg_format={'Age':'max','SibSp':'sum','Fare':'mean'}
titanic_df.groupby('Pclass').agg(agg_format)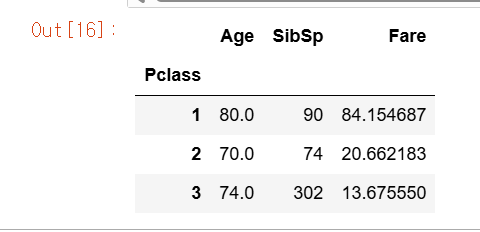
agg( )?
- 그룹화된 데이터에 대해 여러가지 집계 연산을 적용할 수 있도록 도와주는 메서드.
- 주로 평균, 합계, 최댓값, 최솟값 등의 연산을 수행한다.
결손 데이터 처리하기
판다스는 결손 데이터(Missing Data)를 처리하는 편리한 API를 제공한다. 결손데이터는 칼럼에 값이 없는, 즉 NULL인 경우를 의미하며, 이를 넘파이의 NaN으로 표시한다.
- isna( ) 는 NaN 여부를 확인하는 API.
- fillna( )는 NaN값을 다른 값으로 대체하는 API.
isna( )로 결손 데이터 여부 확인
isna( )의 반환값은 True, False이다.⏬
titanic_df.isna().head(3)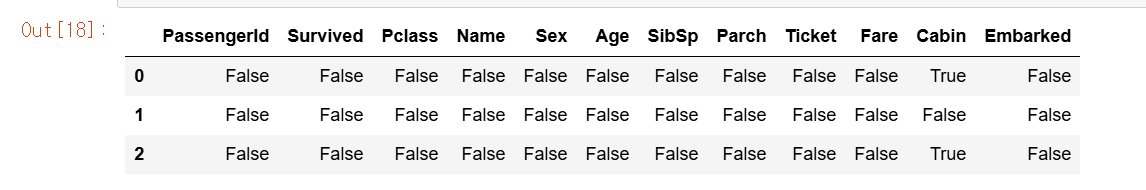
결손 데이터의 개수는 isna( ) 결과에 sum( )를 추가해 구할 수 있다. sum()을 호출 시 True는 내부적으로 숫자 1로, False는 숫자 0으로 변환되므로 결손 데이터의 개수를 구할 수 있다.⏬
titanic_df.isna().sum()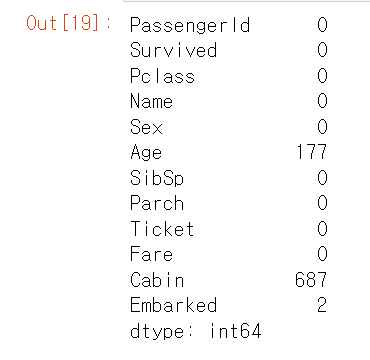
fillna( )로 결손 데이터 대체
titanic_df['Cabin'] = titanic_df['Cabin'].fillna('C000')
titanic_df.head(3)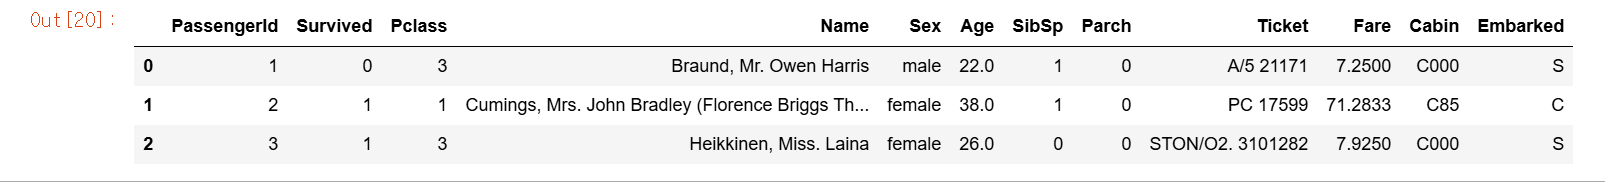
fillna( )를 이용하면 결손 데이터를 편리하게 다른 값을 대체할 수 있다.
타이타닉 데이터 세트의 'Cabin'칼럼의 NaN값을 'C000'으로 대체해보기⏫ inplace = True를 추가하면 원본 데이터도 변경된다.
'Age' 칼럼의 NaN값을 평균 나이로, 'Embarked' 칼럼의 NaN값을 'S'로 대체해 모든 결손 데이터를 처리⏬
titanic_df['Age']=titanic_df['Age'].fillna(titanic_df['Age'].mean())
titanic_df['Embarked']=titanic_df['Embarked'].fillna('S')
titanic_df.isna().sum()
apply lambda 식으로 데이터 가공
판다스는 apply함수에 lambda 식을 결합해 DataFrame이나 Series의 레코드별로 데이터를 가공한다는 기능을 제공한다.
# apply lambda 식으로 데이터 가공
def get_square(a):
    return a**2
print('3의 제곱은: ',get_square(3))
def문 같은 경우에 함수명과 입력 인자를 먼저 선언하고 이후 함수 내에서 입력 인자를 가공한 뒤 결괏값을 return과 같은 문법으로 반환해야한다. lambda는 이러한 함수의 선언과 함수 내의 처리를 한 줄의 식으로 쉽게 변환하는 식이다.
lambda_square = lambda x:x**2
print('3의 제곱은 ',lambda_square(3))
lambda x:x**2':'로 입력 인자와 반환될 입력 인자의 계산식을 분리한다. x는 입력인자를 말하고, 오른쪽은 입력인자의 계산식이다.
lambda식을 이용할 때 여러 개의 값을 입력 인자로 사용해야할 경우, 보통 map( )를 결합해서 사용한다.
a = [1,2,3]
squares = map(lambda x:x**2,a)
list(squares)
titanic_df['Name_len']=titanic_df['Name'].apply(lambda x:len(x))
titanic_df[['Name','Name_len']].head(3)

'Name' 칼럼의 문자열 개수를 별도의 칼럼인 'Name_len'에 생성 ⏫
titanic_df['Child_Adult']=titanic_df['Age'].apply(lambda x:'Child' if x<=15 else 'Adult')
titanic_df[['Age','Child_Adult']].head(8)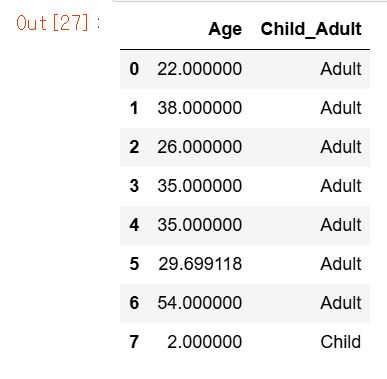
Lambda식에서 if else절을 사용해 조금 더 복잡한 가공을 하면, 나이가 15세 미만이면 'Child', 그렇지 않으면 'Adult'로 구분하는 새로운 칼럼 'Child_Adult'를 apply lambda를 이용⏫
lambda에서 if else주의할 점은 if절의 경우 if식보다 반환값을 먼저 기술해야한다. else if는 없다.
titanic_df['Age_cat'] = titanic_df['Age'].apply(lambda x : 'Child' if x<=15 else ('Adult' if x<=60 else 'Elderly'))
titanic_df['Age_cat'].value_counts()
'Age'가 15세 이하이면 'Child'를 적용하고, 60세 이하이면 'Adult', 그 이상은 'Elderly를 적용한 새로운 'Age_cat' 칼럼을 생성한다. Age_cat 값에서 각 값의 개수를 계산한다.⏫
# 나이에 따라 세분화된 분류를 수행하는 함수 생성
def get_category(age):
cat = ''
if age <= 5:cat = 'Baby'
elif age <=12:
cat='Child'
elif age <=18:
cat='Teenage'
elif age <=25:
cat='Student'
elif age <=35:
cat='Young Adult'
elif age <=60:
cat='Adult'
else: cat='Elderly'
return cat
# lambda식에 위에서 생성한 get_category() 함수를 반환값으로 지정
# get_category(x)는 입력값으로 'Age' 칼럼 값을 받아서 해당하는 cat 반환
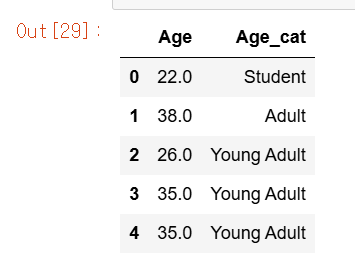
titanic_df['Age_cat']=titanic_df['Age'].apply(lambda x: get_category(x))
titanic_df[['Age','Age_cat']].head()계속 else if 같은 구문을 써야한다면 별도의 함수를 만드는게 좋다.
참고)
파이썬 머신러닝 완벽 가이드, 권철민, 위키북스
'AI > 머신러닝' 카테고리의 다른 글
| [ML 실습] 8일차 복습- 사이킷런 기반 FrameWork 익히기 (1) | 2025.03.12 |
|---|---|
| [ML 실습] 7일차 복습- 사이킷런 머신러닝 만들어보기(개요) (0) | 2025.03.12 |
| [ML 실습] 5일차 복습- 판다스 DataFrame(2) (0) | 2025.01.28 |
| [ML 실습] 4일차 복습- 판다스 DataFrame(1) (0) | 2025.01.28 |
| [ML 실습] 3일차 복습- 넘파이 마지막, 판다스 시작 (1) | 2025.01.27 |


